Multiple Views available
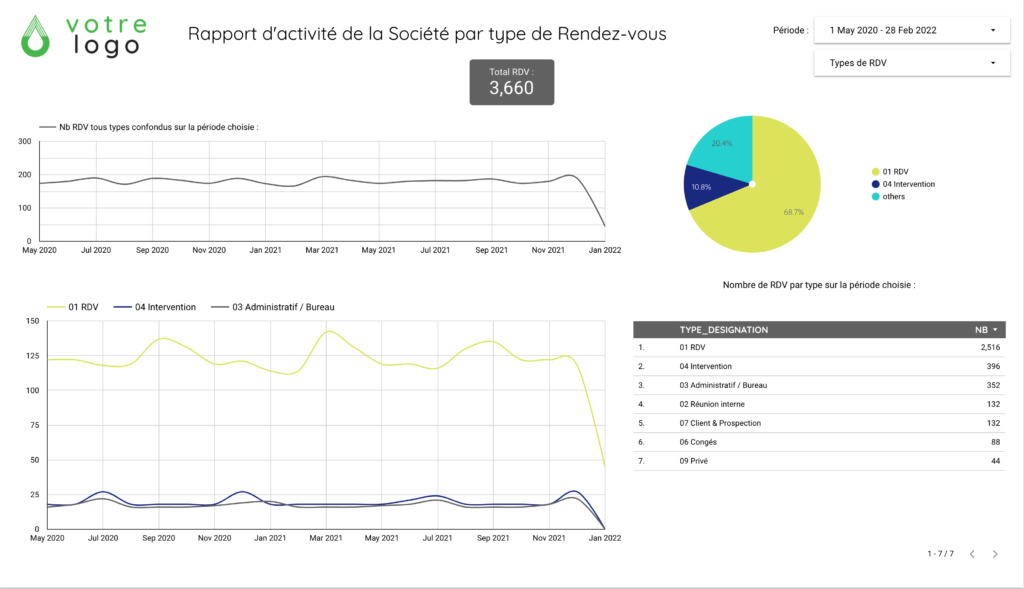
Display your Statistics in a beautiful way-
Pie Charts
Time Share by Event Type
-
Time Charts
Follow the evolution of your statistics within a specific time range.
-
Advanced Data Tables
Sort & Filter your Data Tables, showing extreme values.
-
Map Showcase
Do you use Adresses or GPS Coordinates on your Events ? Show them directly on a custom Map.
-
Table Combination
Upon Request, we can merge your Event & User Tables for in-depth analysis.
-
Customize look & feel
Get your tables & charts with your own branding guidelines. Perfect for that next Meeting !
-
Data Export
Export as a XLSX or Google Sheets format.
-
Share Results
Real-Time sharing of your views with other collaborators.

